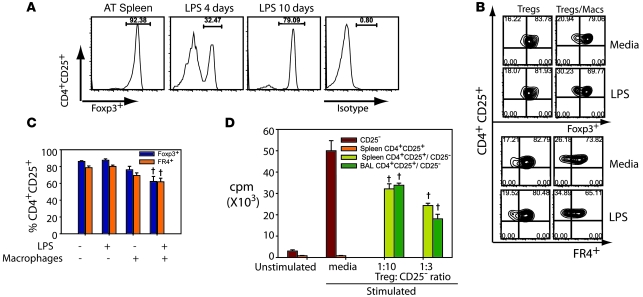
Figure 4. Phenotype and function of alveolar Tregs during resolution of ALI.
(A) Histograms showing the percentage of Foxp3+ cells in the pool of donor CD4+CD25+ splenocytes (AT spleen) as well as in CD4+CD25+ cells recovered in the BAL from LPS-injured Rag-1–/– mice on days 4 and 10 after LPS. Labeling for isotype control Ab at day 10 is also shown. (B) Purified Tregs from naive WT spleens were cultured in the presence or absence of 100 ng/ml LPS and/or macrophages. Representative flow cytometry shows the relationship between Foxp3 and FR4 expression under different conditions. Numbers within plots denote the percentage of cells in the respective quadrants. (C) Relative expression of Foxp3 and FR4 in CD4+CD25+ cells from the experiments in B. †P < 0.05 versus Tregs without LPS or macrophages. (D) Proliferative responses of CD4+CD25– lymphocytes to 0.5 mg/ml anti-CD3 and irradiated APCs (Stimulated) in the presence or absence of CD4+CD25+ cells isolated from spleen or sorted from BAL of WT mice on day 4 after LPS and cultured at the indicated ratios. Unstimulated CD4+CD25– lymphocytes were not exposed to anti-CD3 and irradiated APCs. †P < 0.05 versus media-stimulated CD25– cells.

