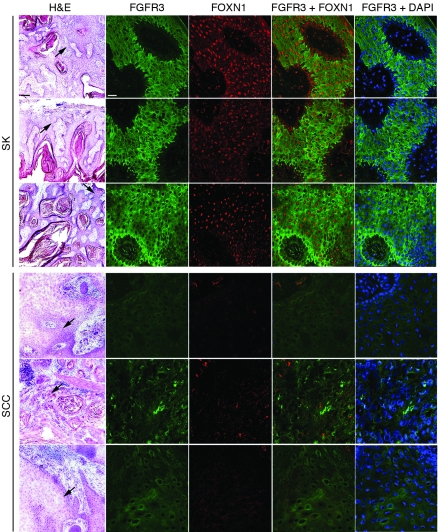
Figure 3. Different expression levels of FOXN1 and FGFR3 in SK versus SCC tissue samples.
Frozen sections from 3 different surgically obtained SK and SCC tissue samples were stained with H&E or analyzed for expression of FGFR3 and FOXN1 by immunofluorescence analysis with corresponding primary antibodies and using FITC- (green) and rhodamine-conjugated (red) secondary antibodies, respectively, for detection. Concomitant staining patterns of FOXN1 and FGFR3 or of FGFR3 and DAPI (used for overall nuclear counterstaining) were visualized by image overlay. Fluorescent images correspond to the areas of the H&E sections indicated by arrows. No positive fluorescence signal was obtained when primary antibodies were preincubated with corresponding blocking peptides for 2 hours prior to incubation on sections (not shown). Scale bars: 200 μm (H&E); 20 μm (fluorescence).

