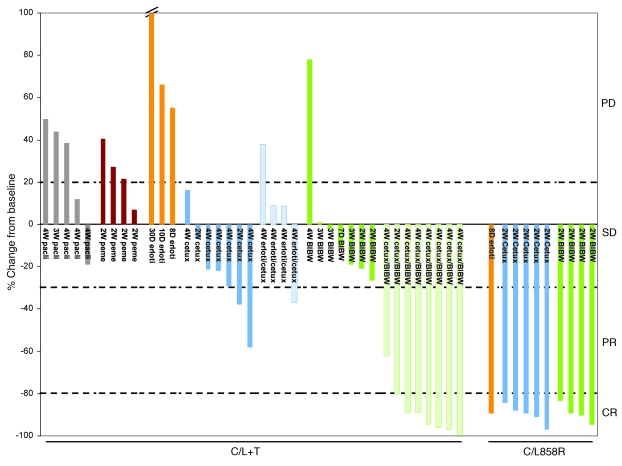
Figure 4. Change in radiographic tumor volume from baseline by treatment for individual lung tumor-bearing C/L858R and C/L+T animals.
Graphed is the percentage change in tumor volume, calculated for individual animals pretreatment and after treatment with paclitaxel (pacli), pemetrexed (peme), erlotinib, cetuximab, BIBW-2992, or combinations of erlotinib or BIBW-2992 with cetuximab. Cutoffs of 20% growth, 30% shrinkage, and 80% shrinkage (dotted lines) are shown to delineate PD, PR, and CR, respectively. Mice that displayed less than 20% growth and less than 30% shrinkage in tumor volume were considered to have SD (see Methods for details.) Statistical significance (calculated using Fisher’s exact test) of BIBW-2992/cetuximab–induced CRs in C/L+T animals versus paclitaxel (P = 0.0047), pemetrexed (P = 0.01), erlotinib (P = 0.02), cetuximab (P = 0.001), and cetuximab/erlotinib (P = 0.01).

