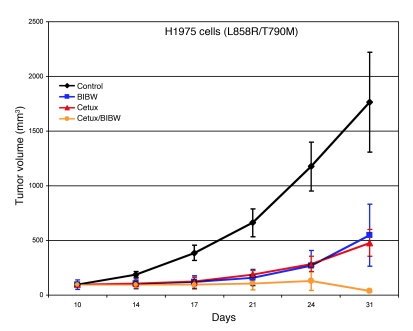
Figure 5. The combination of cetuximab and BIBW-2992 induces regression of H1975 cell xenografts.
Athymic nude mice bearing established H1975 tumor cell xenografts were treated with placebo, cetuximab, BIBW-2992, or cetuximab with BIBW-2992 for 1 month. Five mice were treated in each group. Statistical analysis by a repeated measures ANOVA model is as follows: cetuximab versus control, P = 0.01; BIBW-2992 versus control, P = 0.09; BIBW-2992 plus cetuximab versus control, P = 0.006; BIBW-2992 versus cetuximab, P = 0.66; BIBW-2992 versus BIBW-2992 plus cetuximab, P = 0.13; cetuximab versus BIBW-2992 plus cetuximab, P = 0.02. Shown are representative results from 3 independent xenograft experiments. Data represent mean ± SEM.

