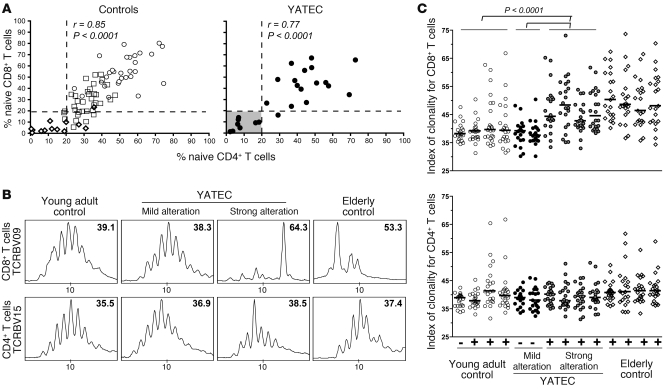
Figure 5. YATECs with marked alterations of the T cell compartment.
(A) Proportions of CD4+ or CD8+ naive T cells in control age groups (open circles, young adults; open squares, middle-aged adults; and open diamonds, elderly) and YATECs (filled circles). A subgroup of YATECs with values similar to those of the elderly group is indicated by a grey square. Spearman’s rank test was used to determine correlations. (B) Representative examples of Vβ family spectratyping analysis performed separately on CD4+ and CD8+ T cell populations from young adult controls, YATECs with mild or profound T cell alterations, and elderly controls. Numbers indicate the index of clonality for each Vβ family. (C) Index of clonality for all Vβ families are shown in young adult controls (n = 4), YATECs with mild (n = 2) or profound (n = 4) T cell alterations, and elderly controls (n = 4). Each symbol represents a single Vβ family. + and – indicate CMV seropositivity. Horizontal bars indicate the median. P values were calculated using the Mann-Whitney U test.

