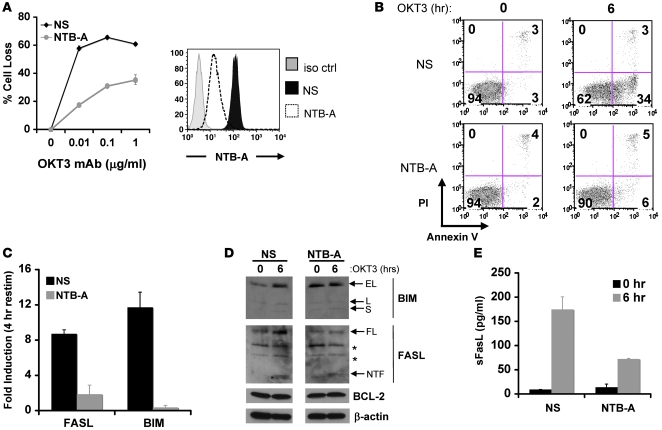
Figure 5. Silencing NTB-A expression reduces TCR-induced upregulation of FASL and BIM and RICD.
(A) Activated PBLs transfected with NTB-A–specific siRNA or NS control siRNA were restimulated with increasing doses of OKT3 mAb, and apoptosis was assessed at 24 hours by PI staining. Surface expression of NTB-A was measured by flow cytometry for NS and NTB-A siRNA–transfected cells relative to cells stained with isotype control Ab. (B) PBLs transfected as described in A were restimulated with OKT3 mAb for 0 or 6 hours, then stained with Annexin V–FITC and PI. Numbers in each quadrant indicate the percentage of cells in that quadrant. (C) Real-time PCR analysis of FASLG and BIM mRNA expression in T cells transfected with NS or NTB-A–specific siRNA, following restimulation with OKT3 mAb. Results are shown as fold induction relative to untreated cells (0 hr), normalized to GAPDH expression. (D) As described in C, cells were lysed following OKT3 restimulation. Cell lysates separated by SDS-PAGE were immunoblotted with the indicated Abs. (E) ELISA detection of sFasL in supernatants collected from siRNA-transfected cells restimulated with OKT3 for 0 or 6 hours.

