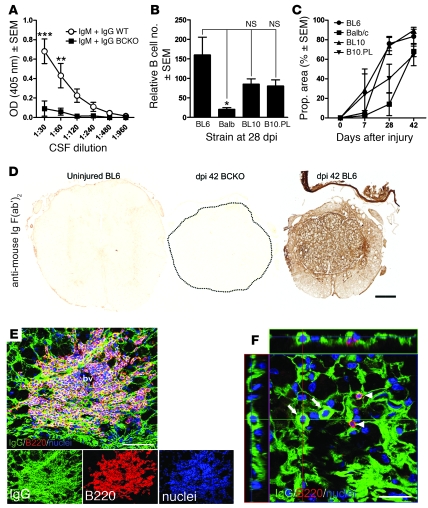
Figure 3. Antibodies, B cells, and plasma cells accumulate in CSF and injured spinal cord.
(A) In contrast to WT mice, BCKO mice fail to produce intrathecal antibodies (ELISA analysis of CSF from n = 8 WT and BCKO mice). (B and C) Quantitation of intraspinal B cell accumulation at 28 dpi (B) and the proportional (prop.) area of IgG staining as a function of time after SCI (C) at the injury site in BL/6 (WT), BALB/c, C57BL/10 (BL10), and B10.PL mice. The intraspinal accumulation of B cells and antibodies is not strain specific, only the magnitude varies; n = 4–8 mice/strain; each bar in B represents the average total number of B220+ lymphocyte profiles in 3 equally spaced sections (1/20th series) spanning 600 μm and centered at the epicenter. (D) Representative sections from uninjured BL/6, SCI BCKO (spinal cord circumscribed by dotted line), and WT mice (42 dpi) reveal the distribution of endogenous antibodies and the specificity of IgG labeling quantified in C, i.e., no labeling exists in spinal cord of uninjured or BCKO mice. (E) Flattened confocal z-stack image reveals accumulation of endogenous antibodies (green, Ig) and Ig+ B cells in the injured spinal cord (42 dpi, individual color channels shown below). bv, blood vessel. (F) Flattened z-stack image with x,y,z-projections showing B220– plasma cells with IgG+ cytoplasm (arrows) nearby but distinct from IgG+B220+ B cells (arrowheads). Scale bars: 200 μm (D); 50 μm (E, top panel); 100 μm (E, bottom panels); 20 μm (F). ***P < 0.001, **P < 0.01 2-way ANOVA with Bonferroni post-test: *P < 0.05, 1-way ANOVA with Tukey’s post-test.

