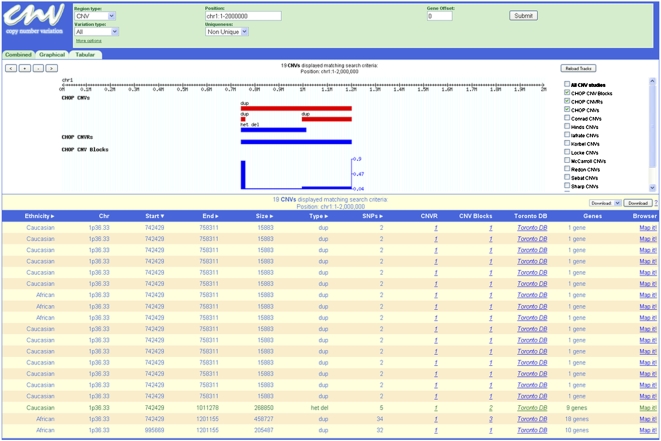
Figure 1.
Copy number variation database web portal (http://cnv.chop.edu). This view shows the “combined” output of nonunique CNVs in our data set within chromosomal “position” chr1:1–2,000,000. The graphical view shows the extent and type of CNVs; (het del) heterozygous deletion; (dup) duplication. The CNVR is indicated, and the frequency graph of the CNV blocks is also shown. The tabular view lists additional information for each individual CNV, including subject ethnicity, chromosomal band (Chr), sequence start and end positions, size in base pairs, type of event, and number of SNPs within (SNPs). The interface also provides links to associated CNVRs and CNV Blocks, the Database of Genomic Variants (Toronto DB), genes within or overlapping the CNV (Genes), and the UCSC Genome Browser (Map It!).

