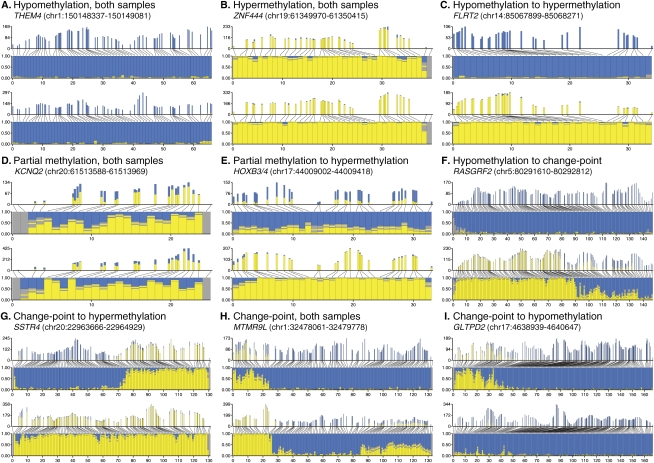
Figure 5.
Patterns of methylation in CpG islands. Graphical representation of methylation patterns in nine CpG islands. A pair of graphics represents each CpG island, one graphic for each sample (top, CHP-SKN-1; bottom, MDA-MB-231). Each graphic shows a pair of plots, both with bars indicating the amount of methylated (yellow) and unmethylated (blue) reads mapping over each CpG. The upper plot shows the absolute numbers of reads and spacing between CpGs. The lower plot shows the proportions of methylated and unmethylated reads. Confidence intervals are indicated in gray, and the yellow bar inside the confidence interval indicates the exact methylation frequency. Similar plots for the remaining CGIs are given in Supplemental Figure S5.

