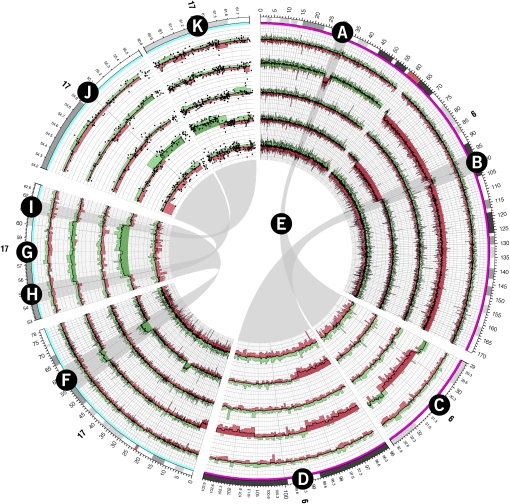
Figure 6.
Copy number profiles for chromosomes 6 and 17 of five follicular lymphoma tumor samples generated from the Affymetrix Mapping 500K array. Probe values were averaged across 20 adjacent probes. Several regions showing large copy number changes are shown on ideograms with an expanded scale. The structure of the histogram track is the same as used in Figure 5. Regions A and B on chromosomes 6 are shown at 10× magnification on ideograms C and D, respectively, with ribbons E connecting these regions with their zoomed ideograms. Similarly, region F on chromosome 17 is shown at 5× magnification as ideogram G. Regions H and I on ideogram G are shown at 40× magnification on ideograms J and K, respectively. Individual probe values are shown as scatterplots on ideograms J and K.

