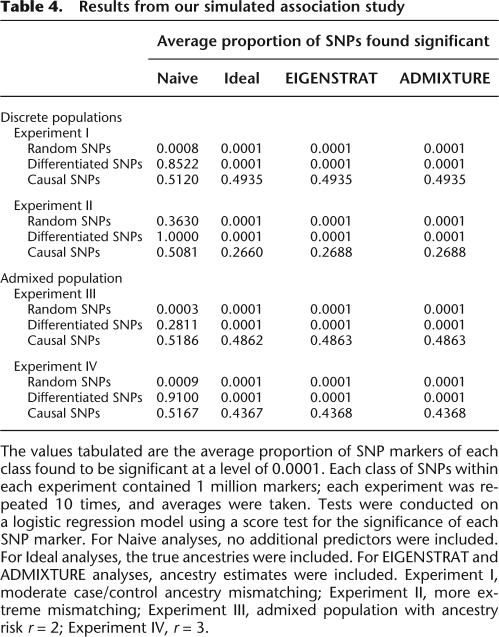
Table 4.
Results from our simulated association study
The values tabulated are the average proportion of SNP markers of each class found to be significant at a level of 0.0001. Each class of SNPs within each experiment contained 1 million markers; each experiment was repeated 10 times, and averages were taken. Tests were conducted on a logistic regression model using a score test for the significance of each SNP marker. For Naive analyses, no additional predictors were included. For Ideal analyses, the true ancestries were included. For EIGENSTRAT and ADMIXTURE analyses, ancestry estimates were included. Experiment I, moderate case/control ancestry mismatching; Experiment II, more extreme mismatching; Experiment III, admixed population with ancestry risk r = 2; Experiment IV, r = 3.

