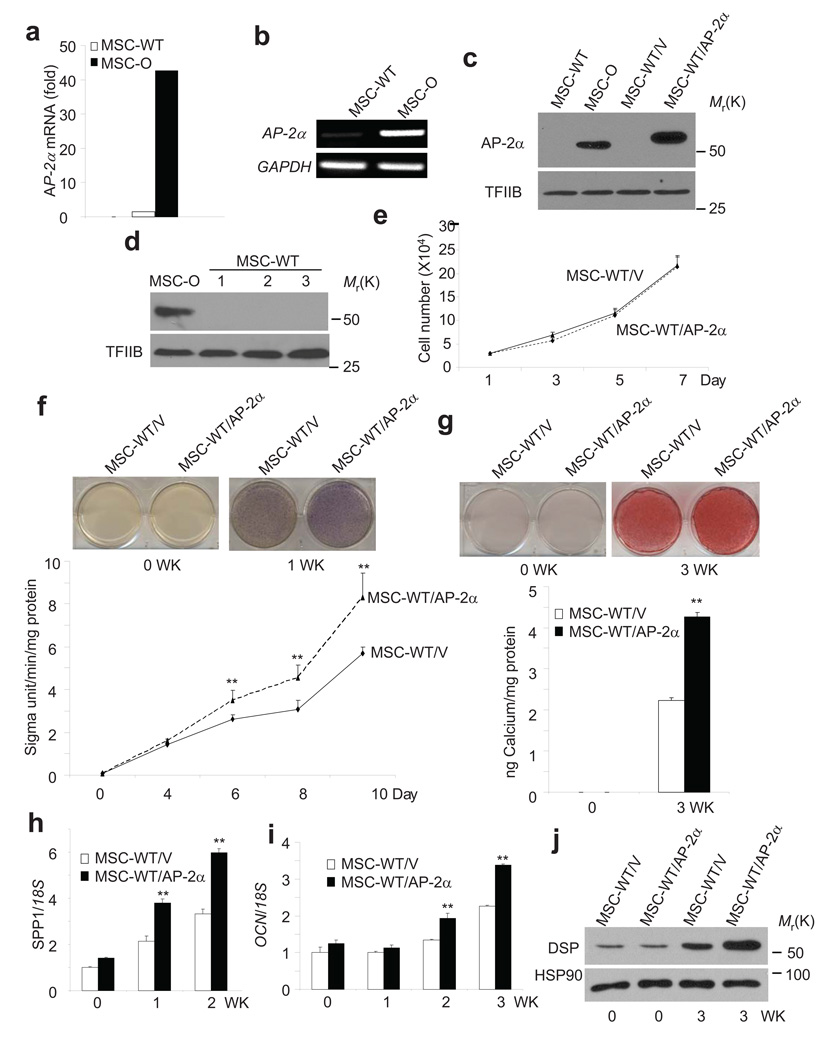
Figure 3. BCOR mutation increases AP-2α expression in MSC-O cells.
a, Gene expression profile revealed that AP-2α was highly expressed in MSC-O cells. b, AP-2α was highly expressed in MSC-O cells compared with MSC-WT cells. AP-2α expression was determined by RT-PCR. GAPDH was used as an internal control. c, AP-2α was highly expressed in MSC-O cells compared with MSC-WT cells as determined by Western blot analysis. Uncropped images of the blots are shown in the Supplementary information. d, AP-2α was not detected in normal MSCs cells from three different normal human subjects. Uncropped images of the blots are shown in the Supplementary information. e, Over-expression of AP-2α did not affect MSC proliferation. Values are mean ± s.d for triplicate samples from a representative experiment. f, Over-expression of AP-2α increased ALP activity in MSC cells. Values are mean ± s.d for triplicate samples from a representative experiment. Student’s t test was performed to determine statistical significance. **P < 0.01. g, Over-expression of AP-2α increased mineralization in MSCs. Values are mean ± s.d for triplicate samples from a representative experiment. Student’s t test was performed to determine statistical significance. **P < 0.01. h, Over-expression of AP-2α enhanced SPP1 expression in MSCs. SPP1 was determined by Real-time RT-PCR. Values are mean ± s.d for triplicate samples from a representative experiment. Student’s t test was performed to determine statistical significance. **P < 0.01. i, Over-expression of AP-2α enhanced OCN expression. OCN was determined by Real-time RT-PCR. Values are mean ± s.d for triplicate samples from a representative experiment. Student’s t test was performed to determine statistical significance. **P < 0.01. j, Over-expression of AP-2α enhanced DSP expression in MSC cells. DSP expression was determined by Western blot analysis. HSP90 was used as an internal control. Uncropped images of the blots are shown in the Supplementary information.

