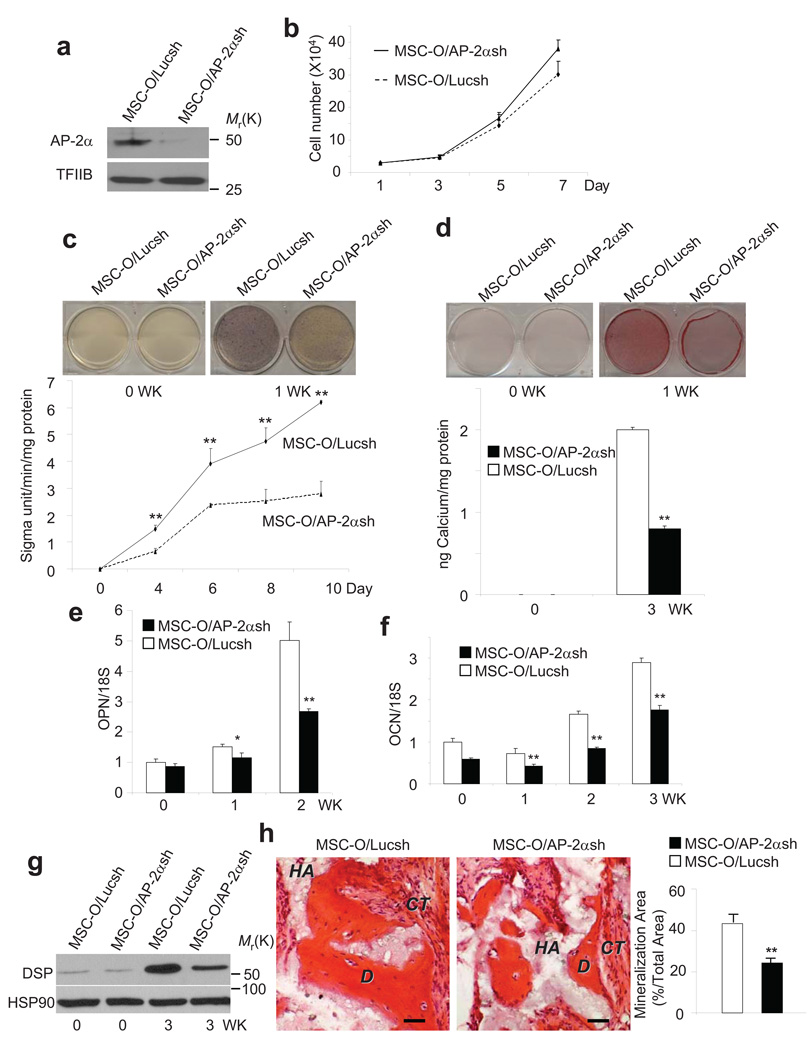
Figure 4. AP-2α is a key mediator for enhancing osteo/dentinogenic potentials of MSCs by BCOR mutation.
a, The knock-down of AP-2α in MSC-O cells. MSC-O/Lucsh, MSC-O cells expressing luciferase shRNA; MSC-O/AP-2αsh, MSC-O cells expressing AP-2α shRNA. Uncropped images of the blots are shown in the Supplementary information. b, The depletion of AP-2α in MSC-O cells did not significantly affect cell proliferation. Values are mean ± s.d for triplicate samples from a representative experiment. c, The knock-down of AP-2α reduced ALP activity in MSC-O cells. Values are mean ± s.d for triplicate samples from a representative experiment. Student’s t test was performed to determine statistical significance. **P < 0.01. d, The knock-down of AP-2α reduced mineralization in MSC-O cells. Values are mean ± s.d for triplicate samples from a representative experiment. Student’s t test was performed to determine statistical significance. **P < 0.01. e, The knock-down of AP-2α decreased SPP1 in MSC-O cells as determined by Real-time RT-PCR. Values are mean ± s.d for triplicate samples from a representative experiment. Student’s t test was performed to determine statistical significance. *P < 0.05; **P < 0.01. f, The knock-down of AP-2α decreased OCN in MSC-O cells as determined by Real-time RT-PCR. Values are mean ± s.d for triplicate samples from a representative experiment. Student’s t test was performed to determine statistical significance. **P < 0.01. g, The knock-down of AP-2;α decreased DSP expression in MSC-O cells. Uncropped images of the blots are shown in the Supplementary information. h, The knock-down of AP-2α reduced mineralized tissue formation in vivo. Both MSC-O/AP-2α shRNA and MSC-O/Luc shRNA cells were transplanted subcutaneously into the dorsal surface of 10-wk old immunocompromised beige mice. Values are mean ± s.d, n = 5. Student’s t test was performed to determine statistical significance. **P < 0.01. Scale bar, 100 µm.

