
Figure 2.
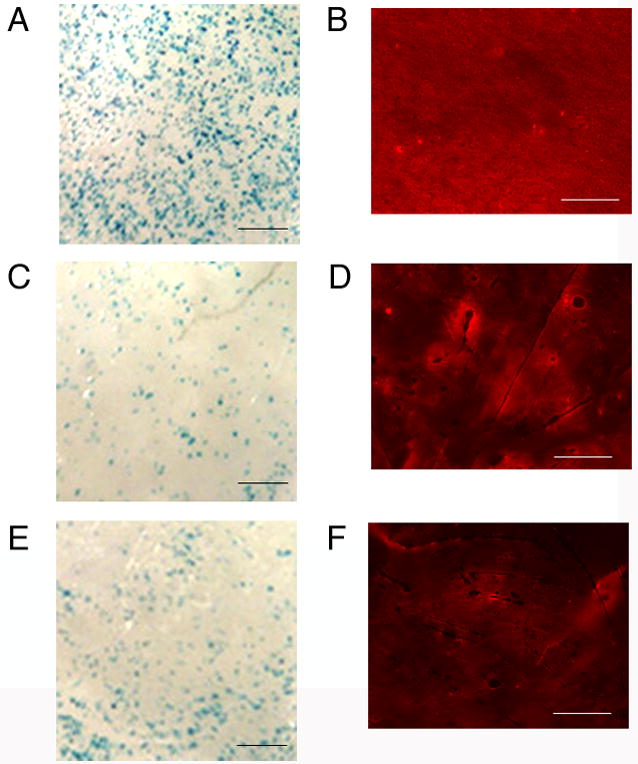
Distribution of transfected cells and immobilized complexes. Transfected cells (blue: A,C,E) and immobilized lipoplexes (red: B,D,F) on fibronectin (25 μg) coated disks. Complexes were deposited by incubation (A,B), 2-step drying (C,D), or 1-step drying (E,F). Transfected cells: 10X magnification, scale bar: 200 μm; fluorescently labeled DNA: scale bar: 400 μm.