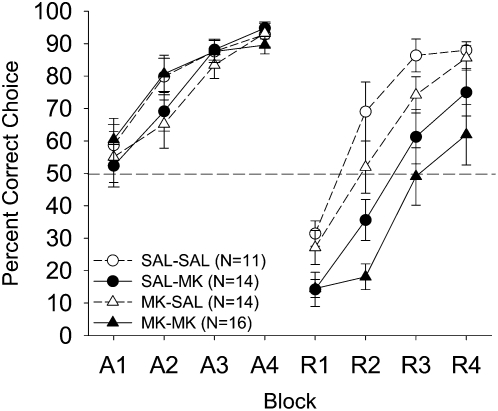
Figure 5.
Mean (± SE) percentage of correct responses for the four MK-801 (2.5-μg) treatment groups in Experiment 2 on P26 as a function of training phase (acquisition or reversal), 12-trial blocks, and treatment. The treatment groups were saline–saline (SAL–SAL: ○), saline–MK-801 (SAL–MK: ●), MK-801–saline (MK–SAL: △), or MK-801–MK-801 (MK–MK: ▲). Dashed line at 50% indicates chance performance.

