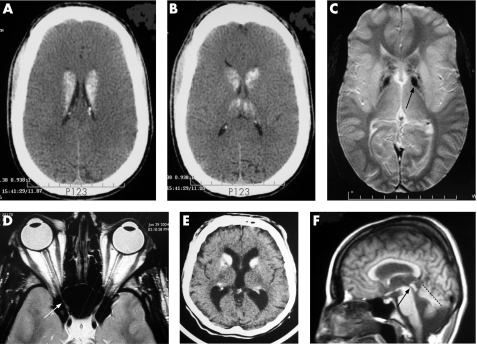
Figure 2 Brain CT and MRI scans of affected patients: (A–D) VI and (E, F) IV6. (A, B) Axial CT scan: global severe thickening of the calvarium related to osteopetrosis, global caudate nucleus and patchy thalamus hyperdensity. (C) T2 gradient‐echo MRI: low heterogeneous signal in putamen and a signal in pallidum (black arrow). (D) Axial T2 scan in optic‐nerve plane: decreased calibre of optic nerve due to compression of the optic nerve within the optic canal (white arrow). (E) Axial CT scan: mild thickening of calvarium and hypredensity of the caudate nuclei. (F) Sagittal T2‐weighted MRI: mild ventricular dilatation without stenosis of acqueduc of Silvius (black arrow), and mild vermian hypoplasia (dotted line).

An official website of the United States government
Here's how you know
Official websites use .gov
A
.gov website belongs to an official
government organization in the United States.
Secure .gov websites use HTTPS
A lock (
) or https:// means you've safely
connected to the .gov website. Share sensitive
information only on official, secure websites.
