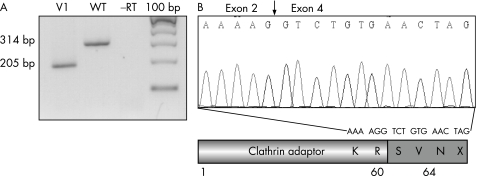
Figure 4 (A) Reverse transcription (RT) PCR analysis using primers in exon 2 and 5 of the AP1S2 cDNA. Agarose‐gel electrophoresis of RT‐PCR products generated with lymphoblasts from patient (V1) and from a control subject (wild type; wt). (B) Sequence analysis of RT‐PCR products from the patient V1 and consequences of the splice mutation at the protein level.

An official website of the United States government
Here's how you know
Official websites use .gov
A
.gov website belongs to an official
government organization in the United States.
Secure .gov websites use HTTPS
A lock (
) or https:// means you've safely
connected to the .gov website. Share sensitive
information only on official, secure websites.
