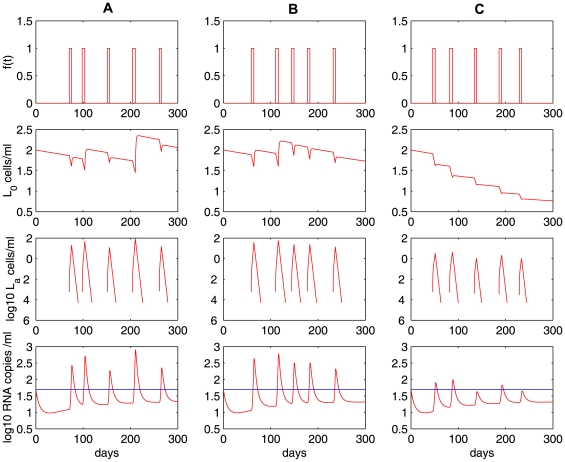
Figure 3. Stochastic simulations of the model with programmed expansion and contraction (Eq. (4)).
The model with programmed expansion and contraction of latently infected cells can generate viral blips with reasonable amplitude and duration.  ,
,  . Column A:
 . Activated latently infected cells divide about
  times over an interval [4],[6] days. No statistically significant decay of the latent reservoir is observed. Column B:
 . The latent reservoir decays at a very slow rate. This realization shows a half-life of
  months. Column C:
 . Activated cells divide about
  times over the same time interval. The latent reservoir decays more quickly than it does in B, corresponding to a half-life of roughly
  months. The other parameter values used are listed in Table 1. The blue horizontal line represents the detection limit of 50 RNA copies/mL.

