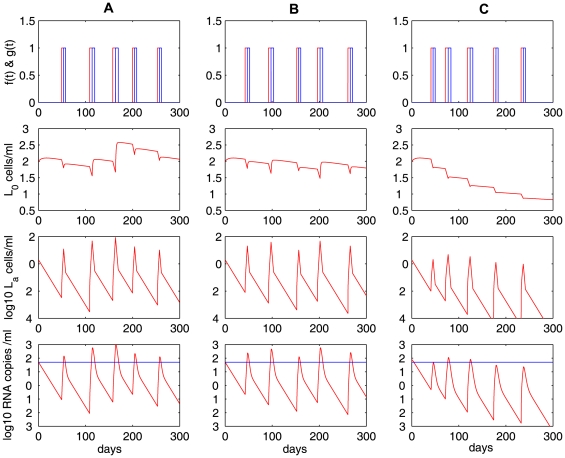
Figure 6. Simulations of the model with a biphasic contraction phase (Eq. (6)).
The model is able to generate viral blips as well as low-level persistent viremia. The low-level viral load is maintained by a low level of activated latently infected cells during the second slower contraction phase in the latent cell response. In the first row,  is the expansion function (red) and
  is the rapid contraction function (blue). Different proliferation rates, i.e.,
  (Column A),
  (Column B), and
  (Column C), result in differential decay characteristics of the latent reservoir as in Figure 3. The other parameter values used are listed in Table 1. The blue horizontal line represents the detection limit of 50 RNA copies/mL.

