
Figure 7. Relative contributions of ongoing viral replication and latent cell activation.

A and B: the effects of ongoing viral replication (influenced by the overall drug efficacy) on the latent reservoir and viral load in the model given by Eq. (6). Different drug efficacies are used:  (red dashed line) and
  (blue solid line). Ongoing viral replication is only a minor contributor to the stability of the latent reservoir and low-level persistent viremia, as indicated by the minor effect of changing drug efficacy from
  to
to  . C and D: relative contributions of ongoing viral replication (
 was fixed) and latent cell activation to the latent reservoir and viral persistence. C: the ratio of
  to
to  , and D: the ratio of
 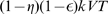 to
to  . We chose
  . The other parameter values used are listed in Table 1.