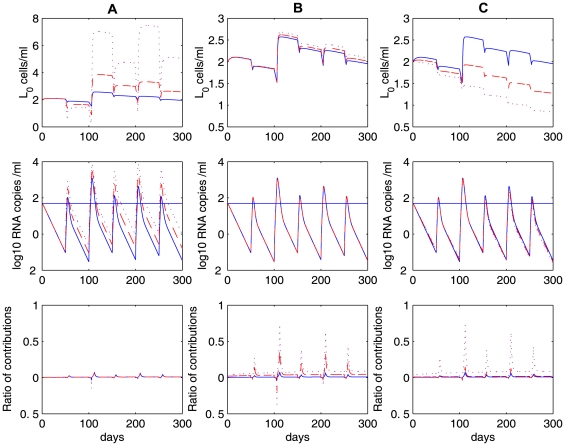
Figure 8. Sensitivity tests on several parameters when studying the relative contributions using model (6).
The upper panels: the latent reservoir size; the middle panels: viral load; and the lower panels: the ratio of the relative contributions, i.e., the ratio of  to
to  . In column A, we use different activation rates:
  (blue solid),
  (red dashed), and
  (purple dotted). There is no change in the ratio of relative contributions. In column B, we use different fractions of new infections that result in latency:
  (blue solid),
  (red dashed), and
  (purple dotted). In column C, we use different reversion rates to latency:
  (blue solid),
  (red dashed), and
  (purple dotted). The other parameter values used are the same as those in Figure 7.

