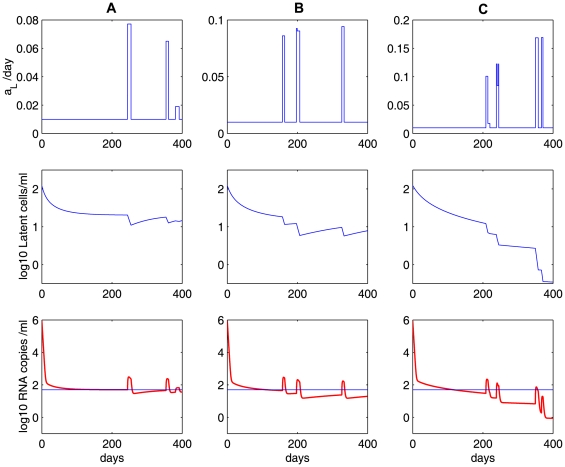
Figure 10. Simulations of the homeostasis model (Eq. (7)) with occasional increases of the transition rate  .
.
A Poisson process with an average waiting time of 2 months is used to model the random encounter between latently infected cells and antigens. We assume the total body carrying capacity of latently infected cells is  . Column A:
 ; column B:
 ; column C:
 . Different values of
  represent different potentials of latently infected cells to renew themselves, and thus lead to different decay rates of the latent reservoir. The other parameter values used are listed in Table 1.

