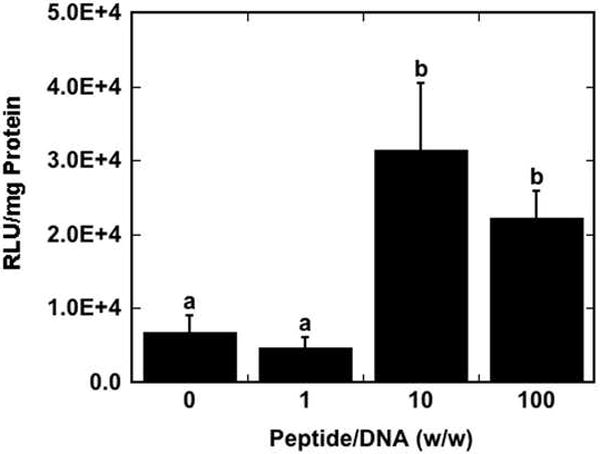
Fig. 1.

Transfection of NIH/3T3 cells as a function of peptide/DNA ratio. Luciferase expression levels are reported as relative light units (RLU) normalized by total protein in the sample well. Data are presented as the mean of triplicate measurements ± standard deviation. A statistical significance with p<0.05 is denoted for values with different letters.
