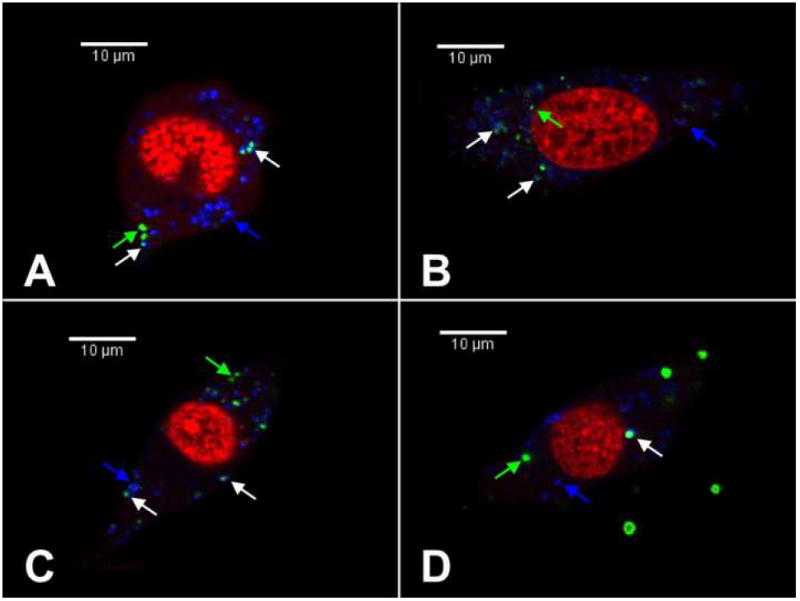
Fig. 5.

Confocal microscopy images depicting colocalization of plasmid DNA and subcellular compartments. NIH/3T3 cells were incubated with immobilized lipoplexes for 24 h prior to imaging. Cells with peptide–lipoplexes formed at peptide/DNA ratios of 0 (A), 1 (B), 10 (C) and 100 (D) are shown. Red indicates nucleic acid staining, green indicates Cy3-labeled plasmid DNA and blue indicates lysosomal staining. Green arrows indicate non-lysosomal DNA, white arrows indicate DNA colocalized with lysosomes and blue arrows indicate lysosomes without Cy3-labeled DNA. A single Z-section representative of the sample is shown for each condition.
