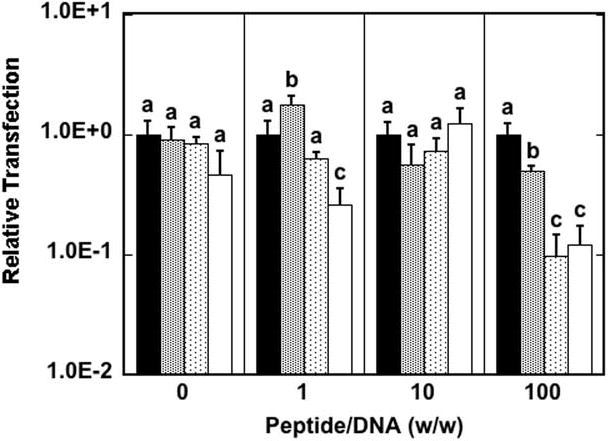
Fig. 7.

Internalization pathways of DNA as a function of peptide content. Transfection was performed at various peptide/DNA ratios without endocytic inhibitors (black bars) or in the presence of amiloride (gray bars), filipin (dotted bars) or chlorpromazine (white bars). Transfection with inhibitor is reported relative to transfection without inhibitor. Data are presented as the mean of triplicate measurements ± standard deviation. A statistical significance with p<0.05 is denoted for values with different letters, with comparisons made only within the same peptide/DNA ratios.
