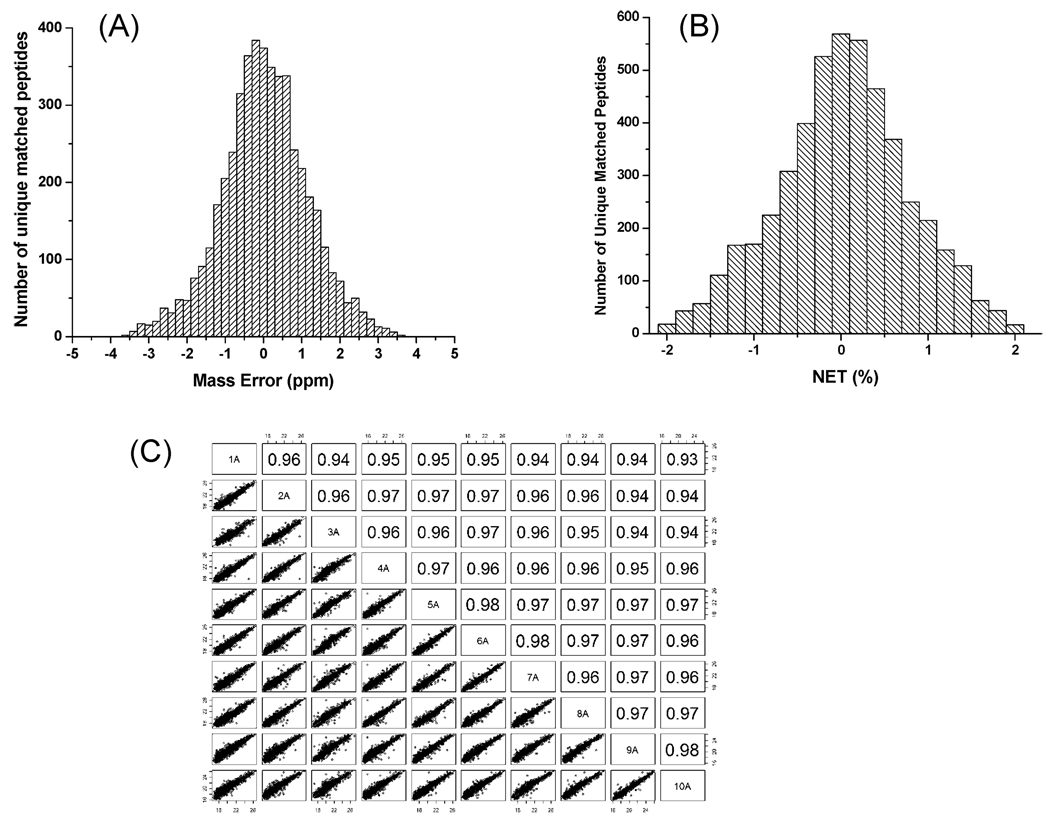
Figure 2.
Histogram of mass error distribution (A), NET error distribution (B), and the reproducibility of 18O-reference peptide abundances (C). The pairwise correlation of reference peptide abundances in C were shown in scatter plot style and as Pearson correlation coefficients for 10 selected samples.

