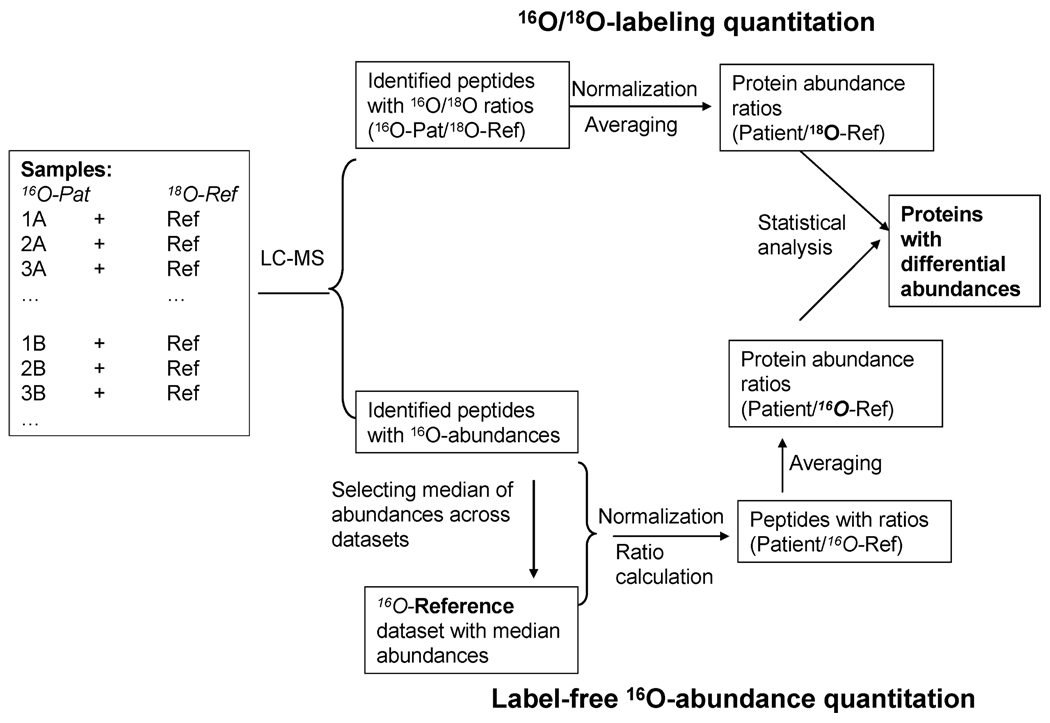
Figure 3.
Data processing scheme for the dual-quantitation data. All patient samples to be analyzed by LC-MS contained equal amounts of 16O-peptides and 18O-reference peptides. For labeling quantitation, the relative peptide abundances for labeled peptides were automatically reported as 16O/18O ratios. Following normalization, protein abundance ratios were generated by averaging peptide abundance ratios within a given protein. For label-free quantitation, a 16O-reference data set was computed using the median abundance for each peptide across the patients. All data sets were normalized against the reference prior to the conversion to a relative ratio format similar to the labeled data. Similar transformation of protein abundance ratios for label-free and labeled data was applied for direct comparison of the two approaches.

