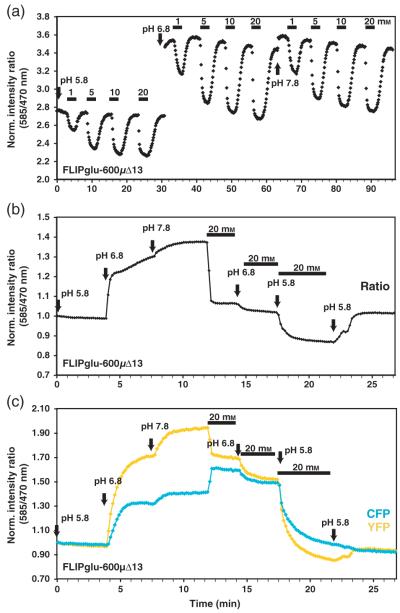
Figure 7.
Effect of external pH on glucose accumulation in roots.
(a) Titration of FLIPglu-600μΔ13 at pH 5.8, 6.8 and 7.8. The bars above the trace show the concentration and duration of glucose treatment. The times at which pH was changed are marked with arrows.
(b) Change in FRET in response to pH in the absence and presence of glucose.
(c) eCFP (cyan) and eYFP (yellow) intensity traces in response to pH and glucose.

