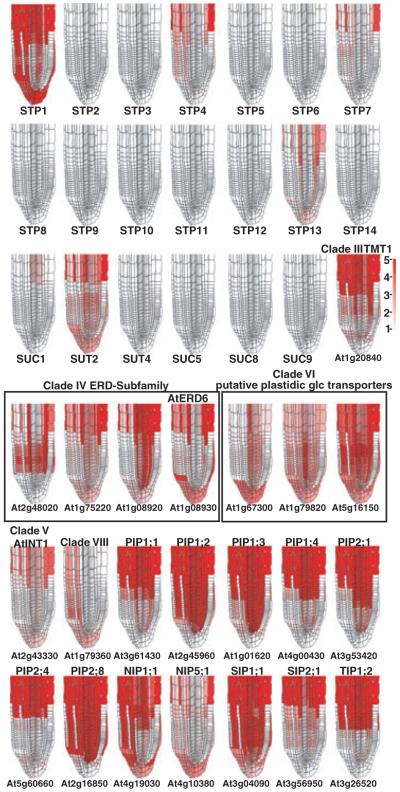
Figure 9.
High-resolution expression mapping in Arabidopsis root tips showing the expression pattern of hexose and sucrose transporter family genes and aquaporins.
Maps for STP (rows 1 and 2) and SUT (row 3) gene families as well as the hexose transporter family and aquaporin genes (rows 4, 5 and 6) are visualized on a root-tip template and false-colored such that low expression is colored white and high expression is red. The scale is given to the right of row 3.

