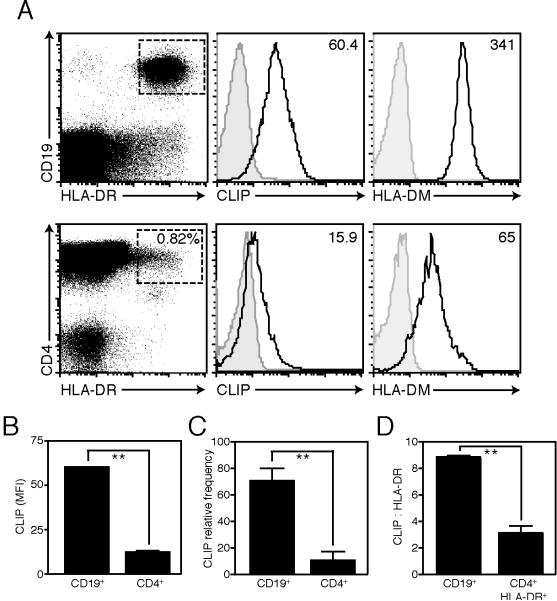
Figure 8. Peripheral blood CD4+HLA-DR+ T cells express less CLIP than CD19+ B cells.
(A) Cell surface expression of CLIP and intracellular expression of HLA-DM in peripheral blood mononuclear cells purified from a representative donor, gated on CD3+CD4+HLA-DR+ T cells or CD19+HLA-DR+ B cells (CD3 gate shown for CD4+ cells; MFI indicated; isotype control shown in grey). (B) CLIP mean fluorescence intensity (MFI; **p=0.001; mean±SEM; n=3), (C) relative frequency of CLIP+ cells (expressed as %CLIP+/%HLA-DR+; **p=0.002; mean±SEM; n=5) in CD3+CD4+ T cells or CD19+ B cells ex vivo and (D) the ratio of CLIP to HLA-DR in CD3+CD4+HLA-DR+ T cells versus CD19+B cells (expressed as [CLIP (MFI)/HLA-DR (MFI)]*100; **p=0.0047; mean±SD).

