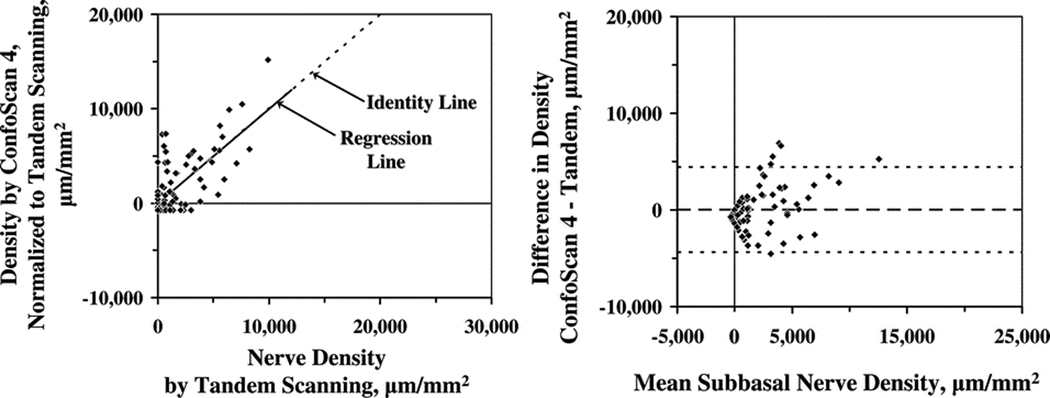
Figure 3.

(Left) Relationship between subbasal nerve densities estimated by using the ConfoScan 4 and by using the Tandem Scanning confocal microscope after densities were normalized by using the regression formula: y = 0.608x - 718, where y is normalized nerve density and x is density estimated by the ConfoScan 4. (Right) The adjusted mean difference between microscopes (ConfoScan 4 – Tandem Scanning) was 0 ± 2,199 µm/mm2. The limits of agreement are indicated by the fine dotted lines.
