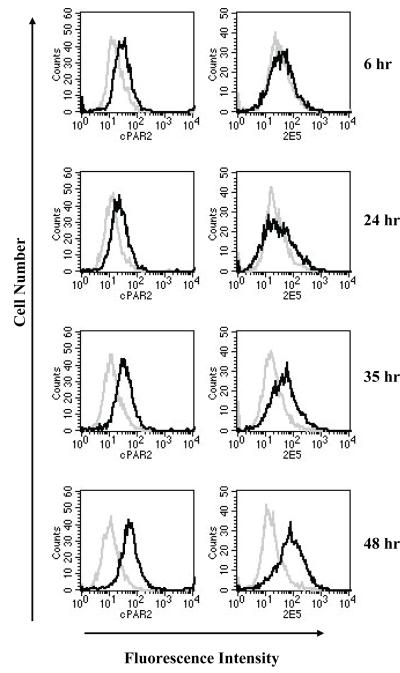
Fig. 3. Time course of PAR2 and C. parvum immunofluorescence.
Cells from an infected monolayer were fixed at different time points post-infection and two portions of the cell suspensions immunolabelled for C. parvum antigen or PAR2, respectively. C. parvum and PAR2 immunofluorescence was acquired by flow cytometry in the FL1 channel. Uninfected cells labeled with C. parvum or PAR2 specific antibody were used as negative control. Histogram overlay shows fluorescence of infected (black) and uninfected cells (grey).

