
Figure 6.
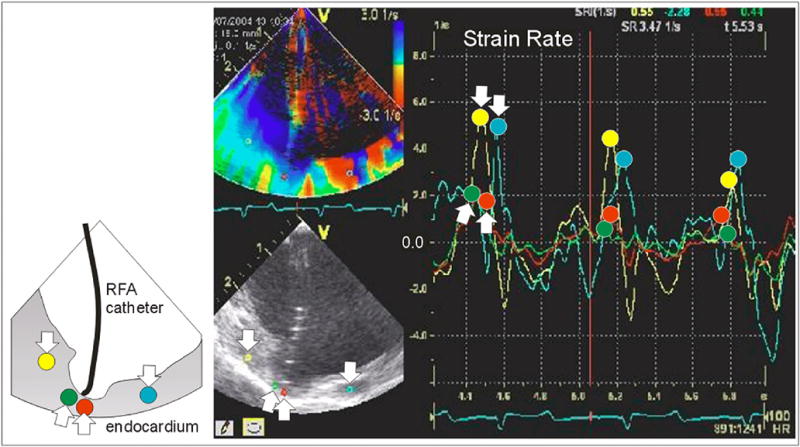
Strain rate imaging following ablation. The cup shaped tissue depression beneath the flexible ablation tip has decreased strain, as shown by the time course of the red and green traces. The yellow and turquoise traces (with “down” arrows) show noticeably greater peak strain rate than the red and green traces (with peaks at the “up” arrows). The diminution in strain rate of this region was still present after the ablation catheter had moved away.