
Figure 1. Summed dominant heterogeneity log odds ratio scores from seven different populations.
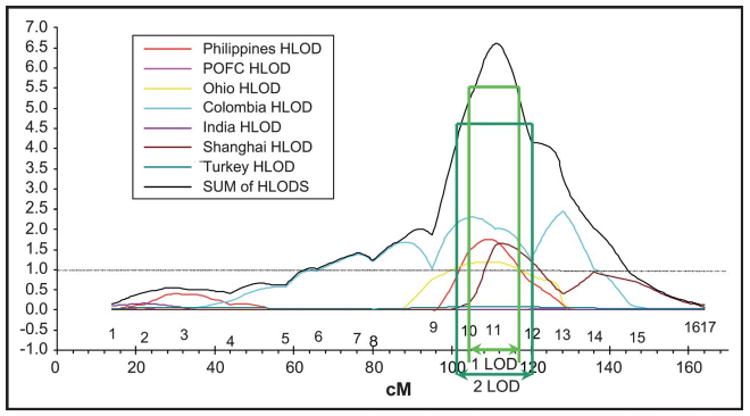
The green arrows indicate the 1 and 2 log odds ratio intervals of linkage. Modified from [20].
Official websites use .gov
A
.gov website belongs to an official
government organization in the United States.
Secure .gov websites use HTTPS
A lock (
) or https:// means you've safely
connected to the .gov website. Share sensitive
information only on official, secure websites.
The green arrows indicate the 1 and 2 log odds ratio intervals of linkage. Modified from [20].