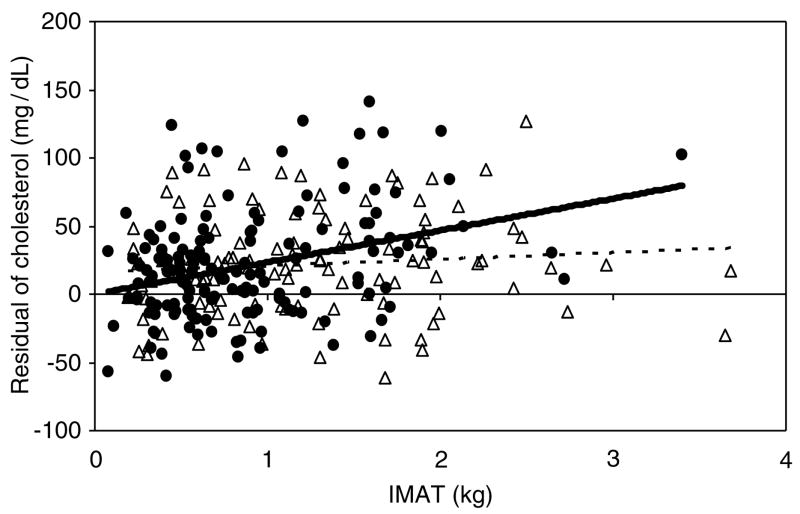
Figure 2.
Residual of total cholesterol after adjustment for SM, VAT, TAT and sex according to the regression equation: T-Chol = 177.75 − 1.04(SM) + 2.98(VAT) − 0.49(TAT) + 13.52(male), (s.e.e. = 38.20 mg/dl) as a function of IMAT (kg) in Ca (●) and AA (△). Solid and dashed lines represent Ca and AA, respectively.

