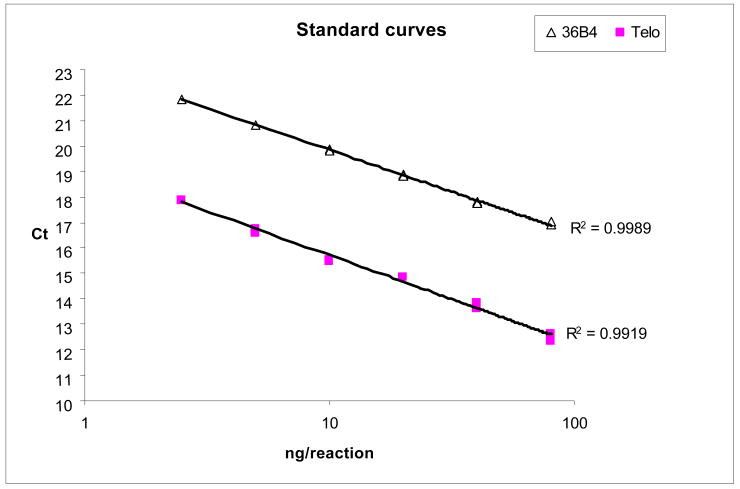
Figure. Standard curves: six DNA concentrations were prepared by serial dilution (dilution factor 2) with the final amounts per reaction ranged from 2.5 to 80 ng. The Ct values in duplicate for Telo were: [17.84/17.88], [16.60/16.76], [15.52/15.48], [14.83/14.85], [13.63/13.86], and [12.35/12.64]. The Ct values in duplicate for 36B4 were: [21.84/21.80], [20.83/20.80], [19.87/19.83], [18.86/18.81], [17.78/17.77], and [16.89/17.00].

An official website of the United States government
Here's how you know
Official websites use .gov
A
.gov website belongs to an official
government organization in the United States.
Secure .gov websites use HTTPS
A lock (
) or https:// means you've safely
connected to the .gov website. Share sensitive
information only on official, secure websites.
