Fig. 2.
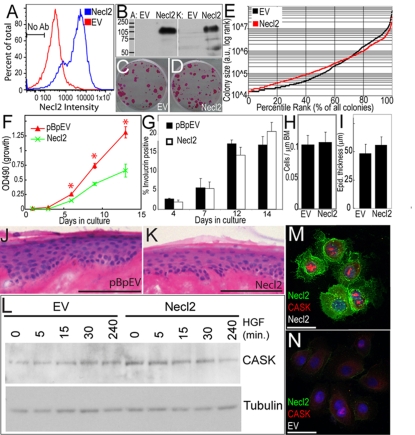
Effects of Necl2 overexpression on growth and differentiation of cultured human keratinocytes. (A) Flow cytometry of keratinocytes transduced within empty vector (EV, red) or Necl2 (blue) and labelled with anti-Necl2. (B) Necl2 immunoblots of Necl2-transduced or control (EV) AM12 packaging cells (A) and keratinocytes (K). Molecular mass markers (kDa) are indicated. (C,D) Representative dishes of control(C) and Necl2- (D) transduced keratinocyte colonies 2 weeks after plating. (E) Quantification of relative size of individual control (black) and Necl2 transduced (red) clones. All clones (n>300) from one experiment are shown; data are representative of three separate experiments. (F) Keratinocyte growth was assessed by measuring mitochondrial activity (OD490; *P<0.05). (G) Flow cytometric determination of proportion of involucrin-positive Necl2-transduced and control keratinocytes. (H,I) Quantification of basal cell density (H) and epidermal thickness (I) in epidermis reconstituted by control (EV) and Necl2-transduced cells cultured on de-epidermised dermis. (J,K) H&E-stained sections of control (J) and Necl2-transduced (K) keratinocytes grown on DED substrates for 2 weeks. (L) Western blot of control and Necl2-transduced keratinocytes cultured in the absence of HGF (0) or stimulated with HGF for the times indicated. Blot was probed with antibodies against CASK or, as a loading control, β-tubulin. (M,N) Representative images of colonies transduced with Necl2 (M) or empty vector (N) stained with antibodies against CASK (red) and Necl2 (green). Error bars in G-I represent s.e.m. Scale bars: 100 μm in J,K; 10 μm in M,N.

