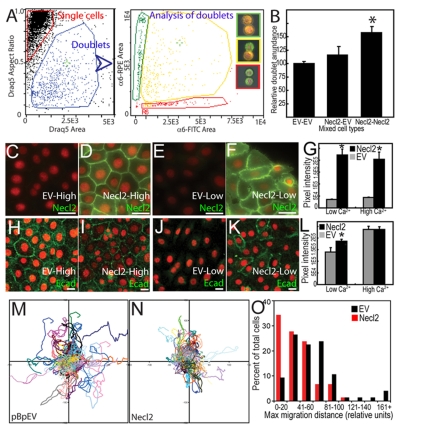
Fig. 3.
Necl2 overexpression influences keratinocyte adhesion and motility. (A) Identification of cell doublets based on Draq5 nuclear area/aspect ratio (left panel; blue gate) and characterisation of doublets by labelling with FITC- and RPE-conjugated anti-α6-integrin antibodies (right). Insert shows representative RPE-RPE (top), RPE-FITC (middle) and FITC-FITC (bottom) stained cell doublets. (B) Quantification of relative RPE-FITC labelled EV-EV, Necl2-EV and Necl2-Necl2 doublets. (C-G) Representative images (C-F) and quantification (G) of Necl2 expression in control (C,E) and Necl2-transduced (D,F) cells cultured under standard (high; C,D) and low-calcium (E,F) conditions. (H-L) Representative images (H-K) and quantification (L) of E-cadherin expression in control (H,J) and Necl2-transduced (I,K) cells cultured under standard (high; H,I) and low-calcium (J,K) conditions. (G,L) Quantification of pixel intensity at cell-cell borders. (M-O) Control (M) and Necl2-transduced (N) cell motility tracks and maximum migration distances (O) relative to a starting position (x,y=0,0) at time=0 minutes. Each line in M,N shows motility of an individual cell. (B,G,L) Error bars represent s.e.m.; *P<0.05. Scale bars: 10 μm in C-F,H-K.

