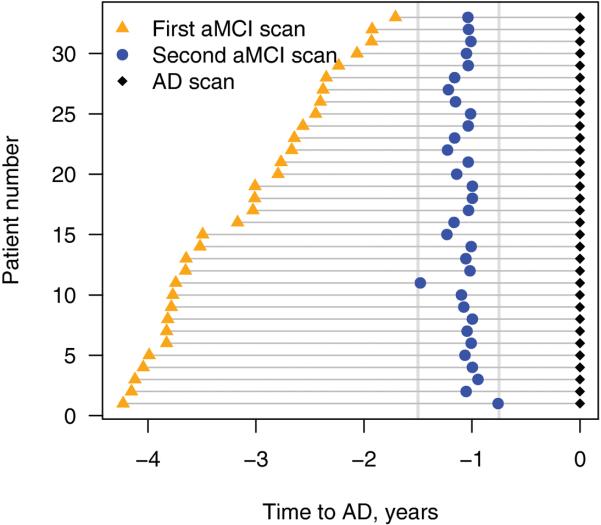
Figure 1.
Time-line representing the time of each MRI scan for each individual (n=33) relative to conversion from aMCI to a clinical diagnosis of AD. The black diamonds represent the scan at the time of conversion. The blue circles represent the scans classified as being one year (9–18 months) before conversion. The orange triangles represent the scans classified as being three years (18–51 months) before conversion.

