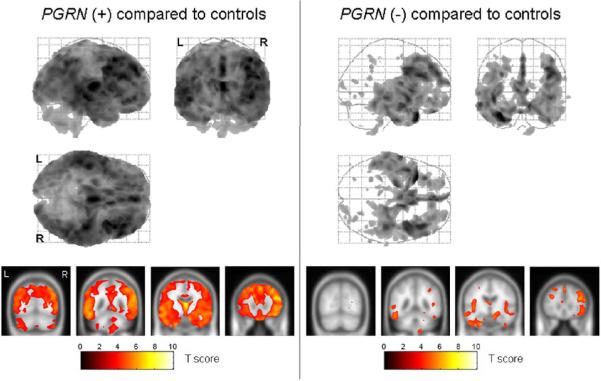
Figure 1.
Grey matter volume differences were assessed between both the PGRN (+) and (−) groups and the control group using VBM at a statistical threshold of p<0.05 after correction for multiple comparisons. The patterns of grey matter loss in the PGRN (+) group compared to controls are shown on the left, while the patterns of grey matter loss in the PGRN (−) group compared to controls are shown on the right. The results of each comparison are shown both on a 3D glass brain render (top) and overlaid on the smoothed customized template at representative slices through the frontal (y=30), temporal (y=−10 and y=−45) and parietal lobes (−70) (bottom). The results show a more widespread and severe pattern of grey matter loss in the PGRN (+) group when compared to controls, than the PGRN (−) group when compared to controls.

