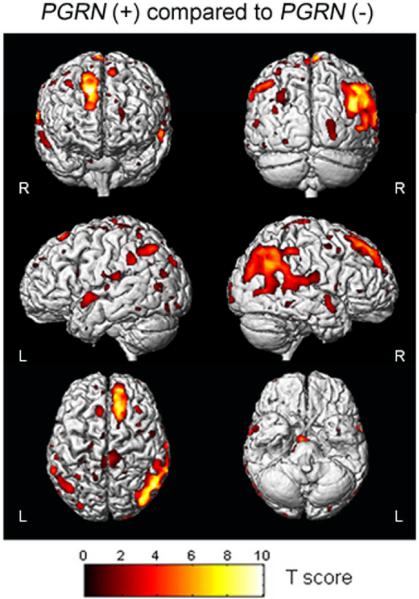
Figure 2.
3D surface renders showing the results of a direct VBM statistical comparison performed between the PGRN (+) and (−) subjects. The highlighted areas show the regions of the brain that have reduced grey matter volume in the PGRN (+) group compared to the PGRN (−) group. No regions of the brain showed reduced grey matter volume in the PGRN (−) group compared to the PGRN (+) group. The results are shown at a statistical threshold of p<0.01, uncorrected for multiple comparisons, and show greater grey matter loss in the frontal and parietal lobes in the PGRN (+) group than the PGRN (−) group.

