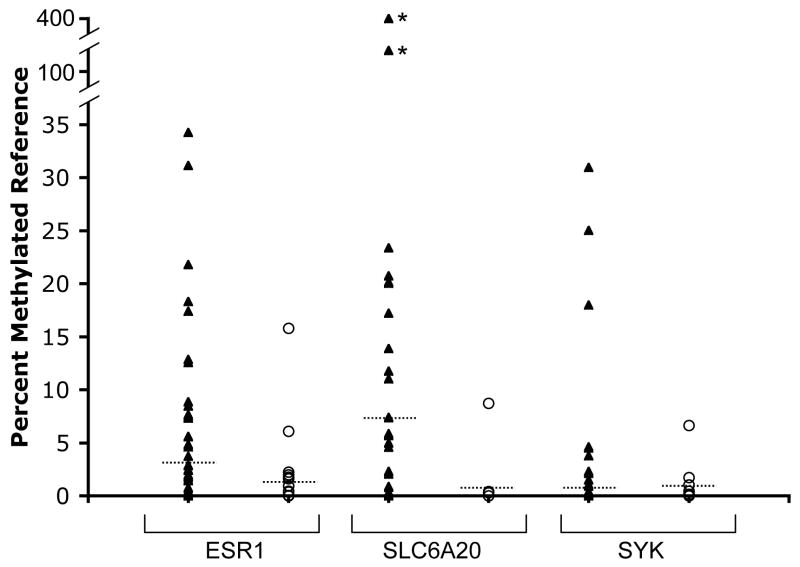
Figure 2.
Comparison of distribution of PMR values for ESR1, SLC6A20 and SYK in MM (triangles) and non-tumor lung (open circles). The median PMR of methylation positive samples is indicated by the dashed line. Two MM samples (indicated with an asterisk) showed very high PMR values for SLC6A20 as indicated by the discontinuous scale.

