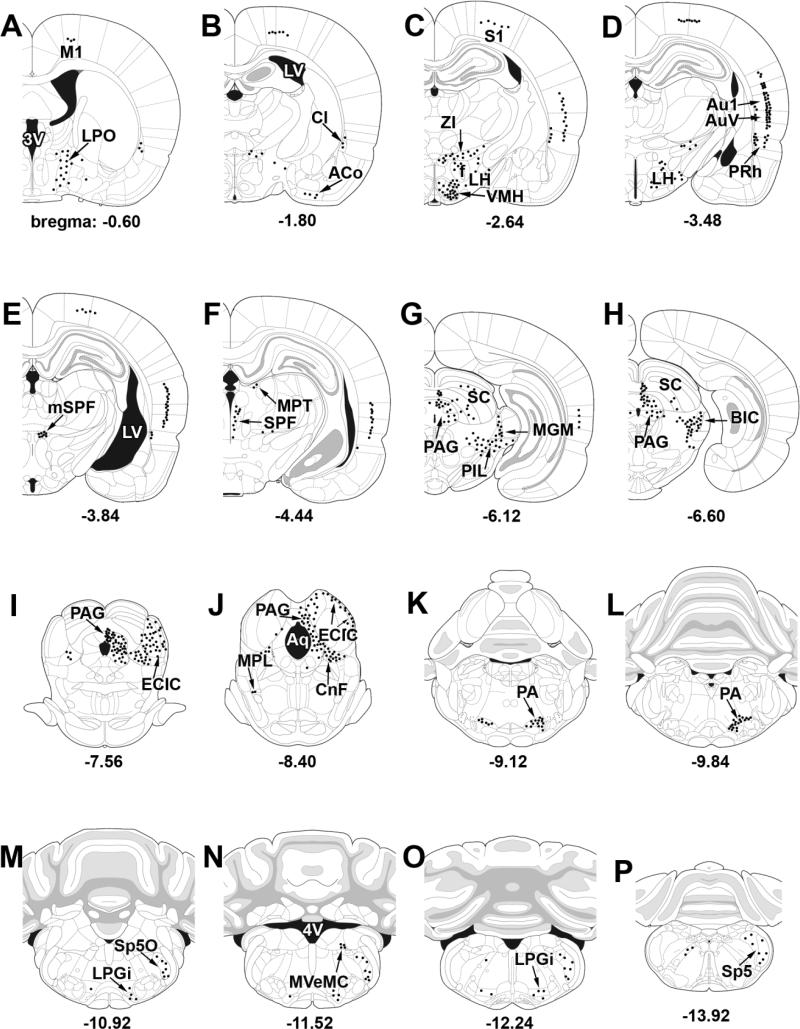
Fig. 5.
A–P: Schematic illustrations of the afferent connections of the MPL. The distribution of CTB-containing cells following CTB injections restricted to the MPL is from injections No. 1, 13, 15, and 18, shown in Figure 3. Dots represent labeled cells in corresponding single 50-μm sections. For abbreviations, see list.

