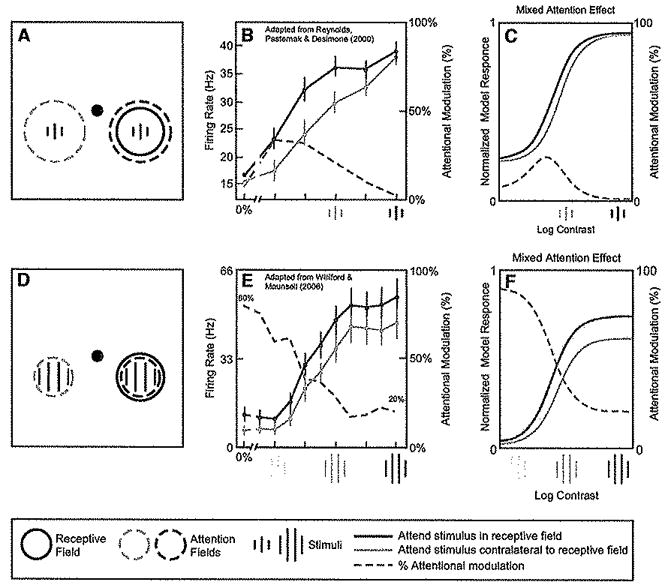
Figure 3. Attentional Modulation of Neuronal Contrast-Response Functions.

(A) Stimulus and task used by Reynolds et al. (2000) while recording neural activity in V4. Sequences of gratings were presented to the left and right visual fields, ons of which was positioned within the receptive field of the recorded neuron. Monkeys were cued to attend either to the stimulus sequence in the receptive field (dashed red circle) or the stimulus sequence in the opposite hemifield (dashed blue circle), to detect a target that appeared in the sequence.
(B) Attention caused the largest percentage increase in firing rates at low contrast (adapted from Reynolds et al., 2000). Red curve and data points, responses as a function of contrast, when attention was directed to stimuli in the receptive field. Blue curve and data points, responses to the identical stimuli when unattended. Dashed gray curve, percentage increase in firing rate at each contrast.
(C) Normalization model of attention can exhibit similar results. Stimuli, receptive fields, and attention fields are not drawn to scale; Simulation parameters are listed in Table 1.
(D) Stimulus and task used in a similar experiment by Williford and Maunsell (2006), also while recording in V4.
(E) Attention caused neither a pure contrast gain change nor a pure response gain change (adapted from Williford and Maunsell, 2006), Rather, the greatest percentage Increase in firing rates was at low contrasts (dashed gray curve), but with the largest absolute increase in firing rates at high contrasts {compare red and blue curves).
(F) Normalization model of attention can exhibit similar results. The simulation was identical to that in (C) except (1) the stimttius was larger and attention field was smaller and (2) additional baseline activity was added for (C) (see Table 1).
