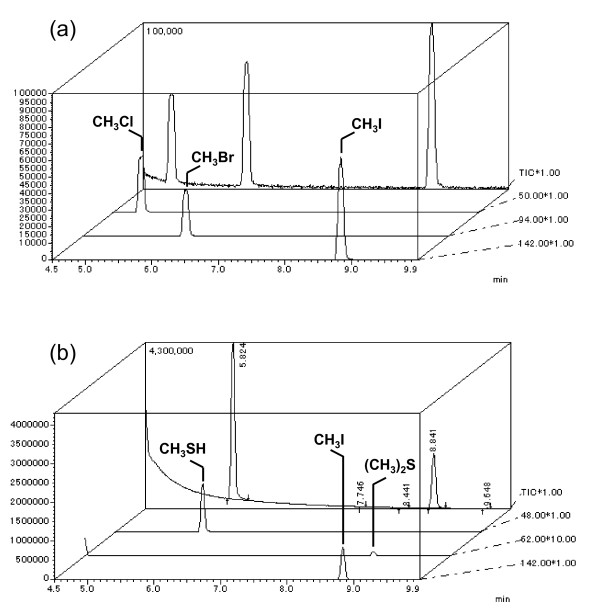
Figure 2.
GC-MS analysis of methyl halides, methanethiol, and DMS from R. sativus. (a) GC-MS spectrum of methyl halide standards (5 ppm each), total ion chromatogram (TIC) of methyl halides (background), and selected ion chromatogram of each methyl halide (foreground). (b) Emission products from R. sativus cultured with 5 mM potassium iodide for 4 days.

