
Figure 8.
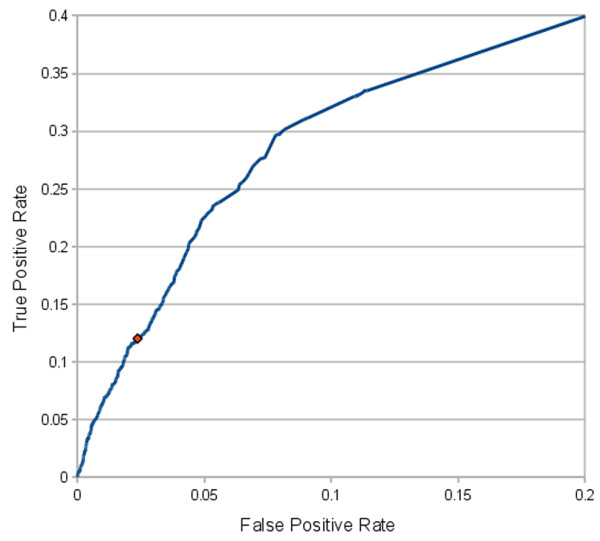
DIANA-microT 3.0 ROC curve. The ROC curve for DIANA-microT 3.0 calculated on the pSILAC data [19]. The suggested loose threshold of DIANA-microT 3.0 has been marked on the diagram with a red dot.
Official websites use .gov
A
.gov website belongs to an official
government organization in the United States.
Secure .gov websites use HTTPS
A lock (
) or https:// means you've safely
connected to the .gov website. Share sensitive
information only on official, secure websites.
DIANA-microT 3.0 ROC curve. The ROC curve for DIANA-microT 3.0 calculated on the pSILAC data [19]. The suggested loose threshold of DIANA-microT 3.0 has been marked on the diagram with a red dot.