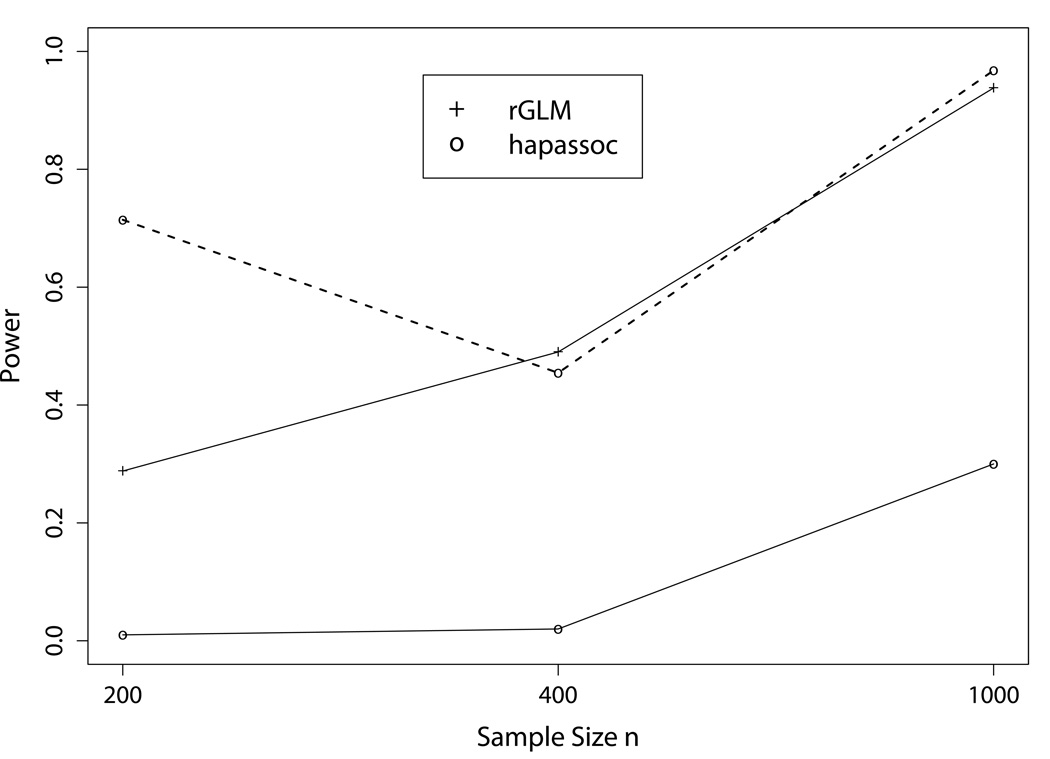
Fig. 2.
Power comparisons between the results from hapassoc and rGLM for the fourth setting with interacting effects between haplotypes from two blocks. The dashed curve shows the powers for hapassoc based on 7, 22, and 155 replicates, the numbers of replicates (out of 500) that converged, for n = 200, 400, and 1,000, respectively.

