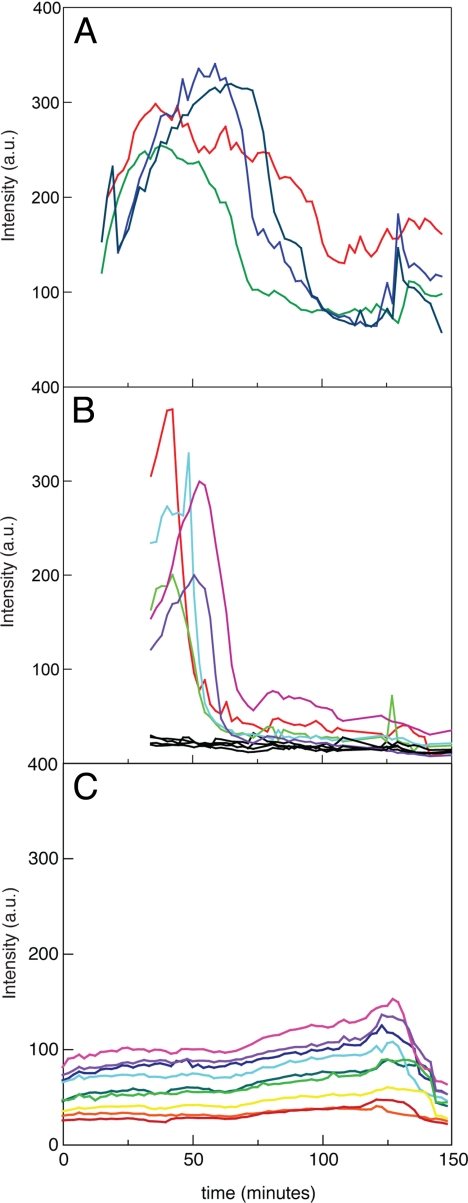
Fig. 2.
RNA kinetics in single E. coli cells upon induction with ATc. (A, B) Time course of total fluorescence in individual E. coli cells in two representative experiments. The t = 0 time is defined as the moment of ATc addition to cells. Measurements are taken at 2-min intervals. (C) Control measurements using cells with expression of full-size EGFP (13). The fluorescence excitation intensity in the control experiments is identical to the intensity used in experiments shown in (A) and (B), but the emission intensity in (C) is attenuated 10-fold.

