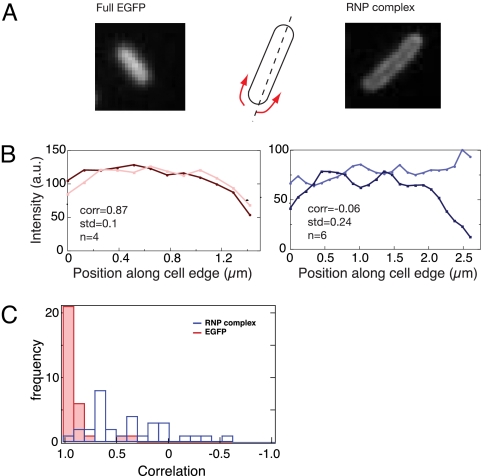
Fig. 4.
Lateral fluorescence distribution in bacterial cells expressing RNP complexes is principally different from the random distribution of EGFP in E. coli cells. (A) Examples of cells expressing full-size EGFP (Left) and RNP complex (Right), and schematic illustration of the lateral fluorescence profiling approximating the cell as rods. (B) Typical examples of lateral fluorescence profiles in cells expressing EGFP (Left) and RNP complex (Right). The two lines in each panel represent the fluorescence intensity on the left and right sides of the rods. Insets show the correlation coefficient and standard deviation, where n is the number of the replicate measurements of one cell (for more examples, see Fig. S10). (C) Histogram of the correlation coefficients for 30 cells expressing EGFP (blue) and 31 cells expressing RNP (red) measured as in B, showing clear differences between the full-size EGFP-expressing cells and the RNP-expressing cells.

