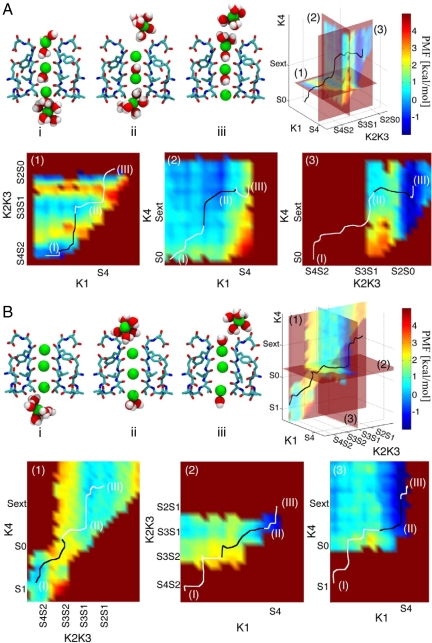
Fig. 1.
(A) KWK conduction mechanism in KcsA: different snapshots of the SF of KcsA along the KWK conduction pathway. Two opposite subunits of the SF region are shown in licorice representation, colored by atom type (Glu-71-Asp-80); K+ ions (green) and water molecules are depicted in Van der Waals (VDW) representation. The potential of mean force and the minimum energy path (MEP) are shown in the 3D plot and reported in 2D maps (1–3). In the 2D maps a black line is used for the fraction of the MEP lying on the plane, while a white line is used for the remaining part of the path. Labels I–III highlight the position along the MEP of the SF structures shown in the snapshots. Outward conduction is initiated by the ions in S4 and S2 moving toward S3 and S1 sites; the cavity ion is attracted toward S4 (map 1, snapshots I–II). This movement in turn destabilizes the ion in S0, which moves toward the extracellular milieu (map 2). Finally, ions in S3 and S1 move to S2 and S0, causing the outermost ion to travel/advance toward the lumen (map 3, snapshot III). The reverse mechanism describes the inward permeation process. (B) KK conduction mechanism in KcsA. Snapshots I–III show the SF of KcsA in different states along the KK conduction pathway. The same notation as in A is adopted. Outward conduction is initiated by the ion in S1 moving toward S0 (map 1). After that, ions in S4 and S2 move to S3 and S1 (map 2). Configuration II is the most stable one along the minimum energy path in the KK conduction mechanism. When the innermost ion reaches S4, upward movements of the ion in S3 to S2 and of the outermost ion to the extracellular milieu conclude the conduction event (map 3, snapshot III). The reverse mechanism describes the inward permeation process.

